Activity Contour Diagram
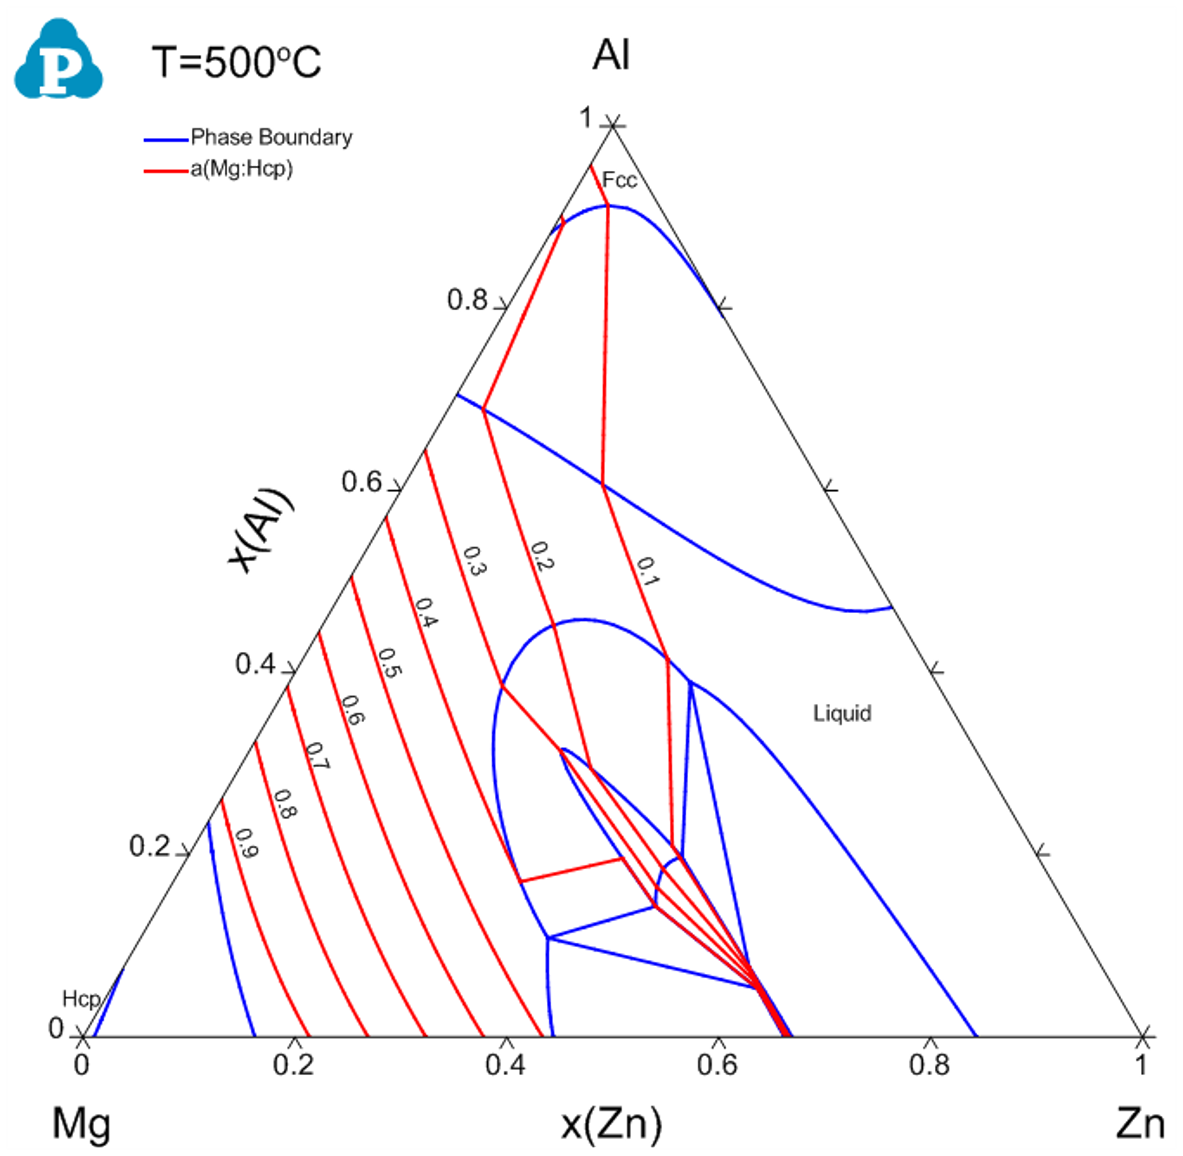
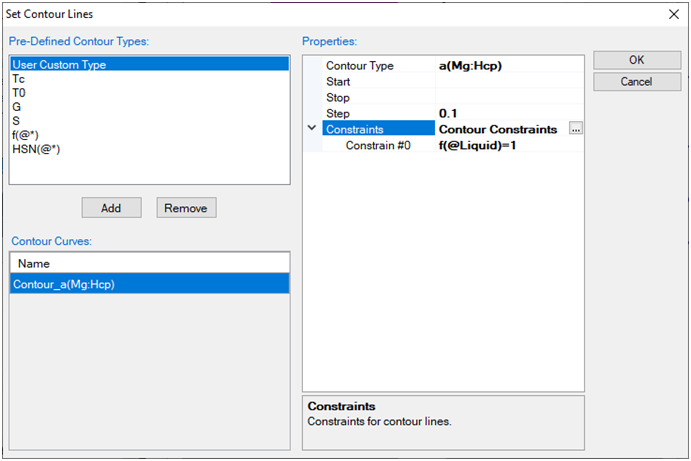
Let’s use the contour diagram of Mg activity in Al-Mg-Zn as the first example. Figure 1(a) shows the input window for calculating the isothermal section of Al-Mg-Zn at 500°C. Click on the “Contour Lines” button, a new window “Set Contour Lines” will pop out, as shown in Figure 1(b). Click on “Add” button and change the “Contour Type” to “a(Mg:Hcp)”, which means that the contour diagram is for the activity of Mg with reference state of Hcp. There are three initials related to which values of the contour lines to be calculated: “Start”, “Stop” and “Step”. In this example, “Start” and “Stop” can be left as empty and Pandat™ will search for all possible values. User can set values for “Start” and “Stop” for specific range of the contour lines. However, the value of “Step” must be given. Another condition “Constraints” will be explained later. Figure 1(b) sets the initial condition to calculate the contour lines for the activity of Mg referring to Mg in Hcp phase with the step size of 0.1. Click “OK” in this window and also in the “Section (2D) Calculation” window to proceed the calculation. The calculated isothermal diagram with the contour lines of Mg activity is shown in Figure 2 after labeling.
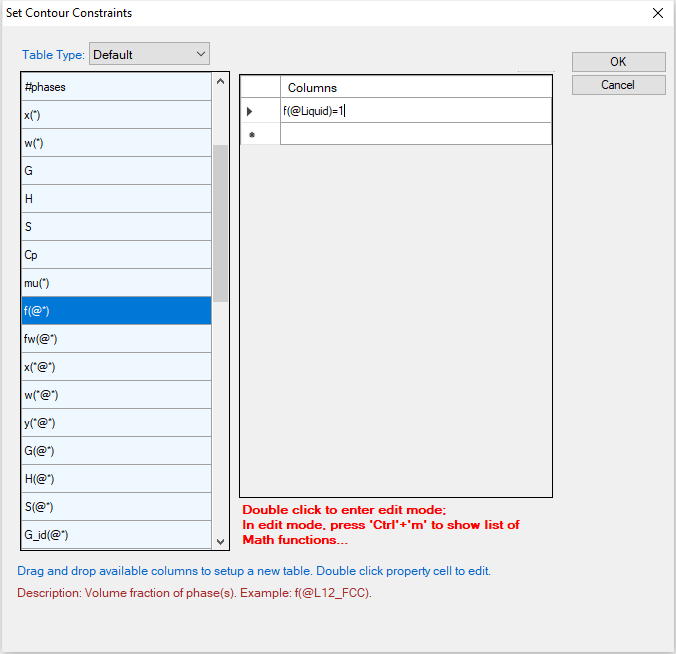
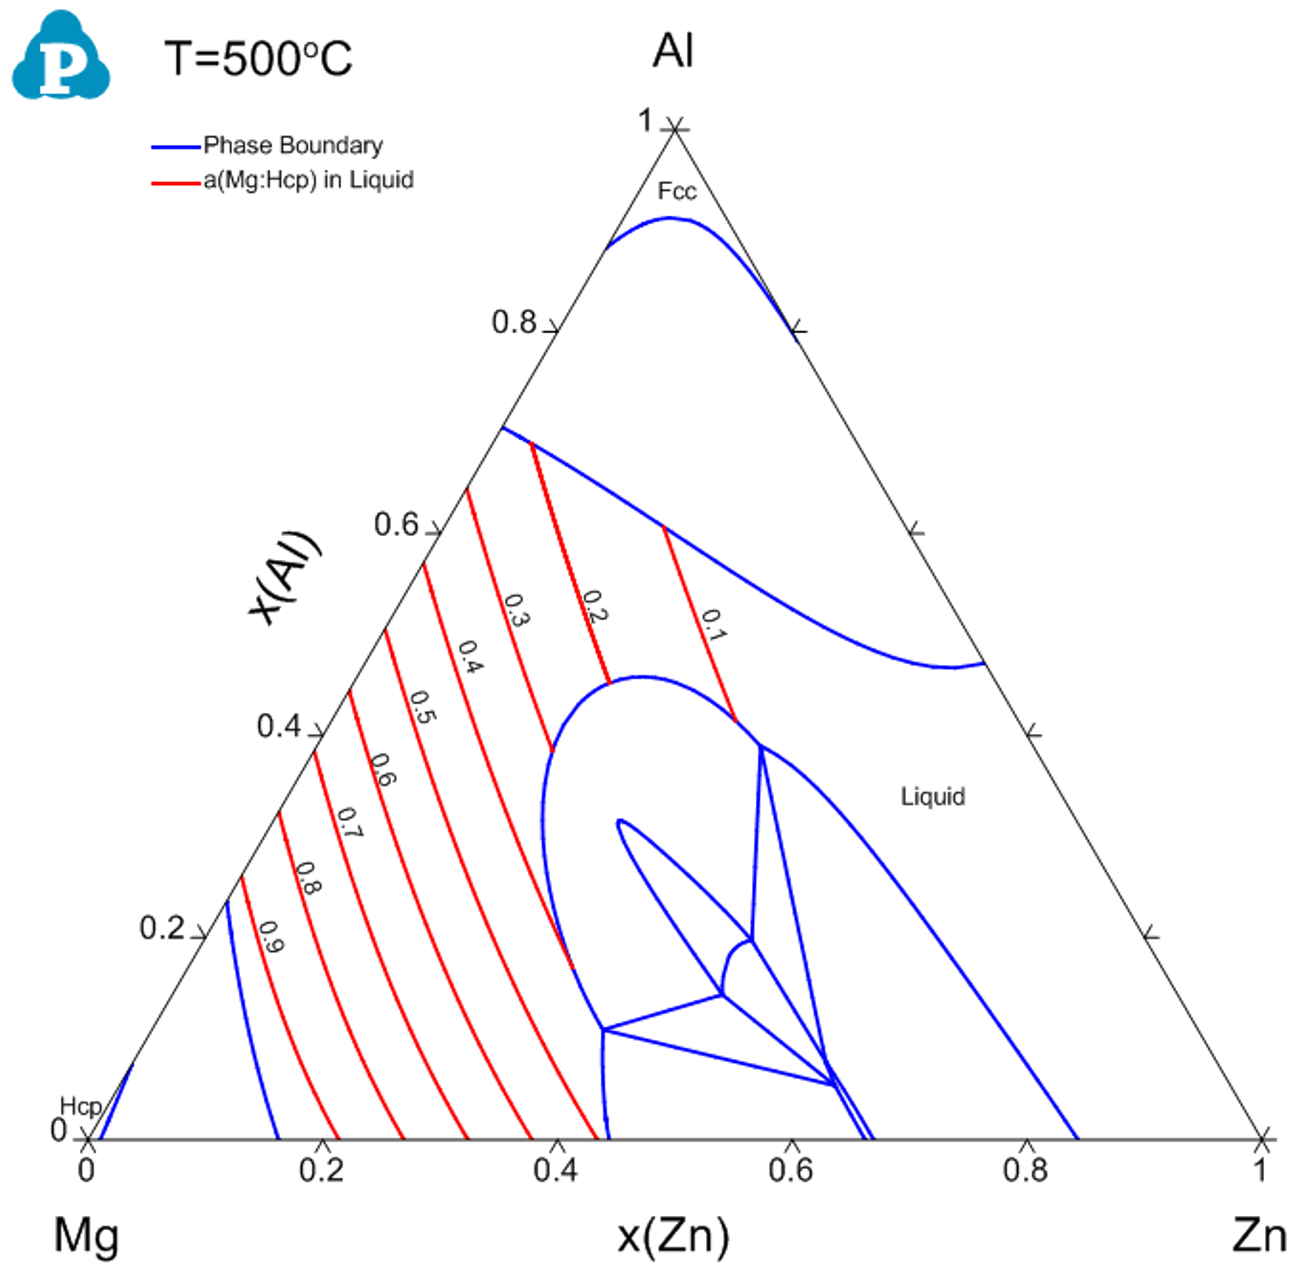
If user want to calculate the contour lines of the Mg activity only in the liquid phase, it can be achieved by setting a constraint in the contour diagram input condition. In Figure 1(b), click on “Contour Constraints”, a small button ![]() will show up. Click on it, A window of “Set Contour Constraints” will pop out as shown in Figure 3. Add “f(@Liquid)=1” as the constraint in this window and then click “OK” to return to “Set Contour Lines” window as in Figure 4. This will set a constraint on the contour line calculation that only the contour lines satisfying the constraint “f(@Liquid)=1” will be calculated. Figure 5 is the calculated phase diagram with the contour diagram of a(Mg) only in the liquid phase region in the isothermal section of Al-Mg-Zn at 500°C.
will show up. Click on it, A window of “Set Contour Constraints” will pop out as shown in Figure 3. Add “f(@Liquid)=1” as the constraint in this window and then click “OK” to return to “Set Contour Lines” window as in Figure 4. This will set a constraint on the contour line calculation that only the contour lines satisfying the constraint “f(@Liquid)=1” will be calculated. Figure 5 is the calculated phase diagram with the contour diagram of a(Mg) only in the liquid phase region in the isothermal section of Al-Mg-Zn at 500°C.